Page 22 - Aquauclature Research and Studies (01)
P. 22

AQUAUCLATURE
                                                                                      12
                        Research and Studies 1 (1): 15-01, 2026                                                   page   of 193


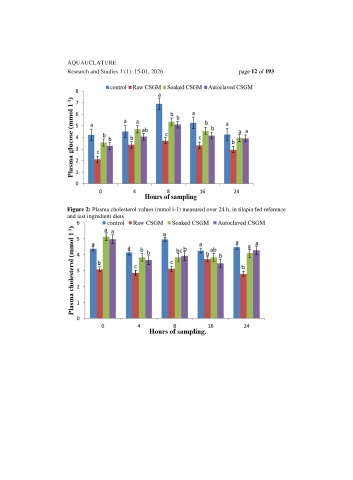
                        Figure 2: Plasma cholesterol values (mmol l-1) measured over 24 h, in tilapia fed reference
                        and test ingredient diets
   17   18   19   20   21   22   23   24   25   26   27