Page 18 - Aquauclature Research and Studies (01)
P. 18

AQUAUCLATURE
                        Research and Studies 1 (1): 15-01, 2026                                                   page   of 193
                                                                                      8

                        computed according to the method as described in Araba and Dale (1990).
                        ANFs in untreated and pre-treated CSGM (tannins, phytic acid, the activity
                        of trypsin inhibitors and saponins) were measured based on the methods de-
                        scribed in AOAC (1997),
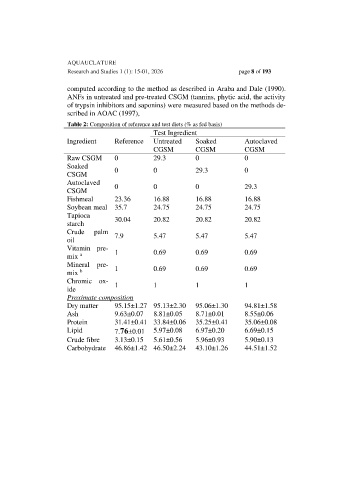
                        Table 2: Composition of reference and test diets (% as fed basis)
                                                     Test Ingredient
                        Ingredient      Reference    Untreated     Soaked          Autoclaved
                                                     CGSM          CGSM            CGSM
                        Raw CSGM        0            29.3          0               0
                        Soaked          0            0             29.3            0
                        CSGM
                        Autoclaved      0            0             0               29.3
                        CSGM
                        Fishmeal        23.36        16.88         16.88           16.88
                        Soybean meal   35.7          24.75         24.75           24.75
                        Tapioca         30.04        20.82         20.82           20.82
                        starch
                        Crude    palm   7.9          5.47          5.47            5.47
                        oil
                        Vitamin  pre-   1            0.69          0.69            0.69
                            a
                        mix
                        Mineral  pre-   1            0.69          0.69            0.69
                            b
                        mix
                        Chromic  ox-    1            1             1               1
                        ide
                        Proximate composition
                        Dry matter      95.15±1.27  95.13±2.30     95.06±1.30      94.81±1.58
                        Ash             9.63±0.07    8.81±0.05     8.71±0.01       8.55±0.06
                        Protein         31.41±0.41  33.84±0.06     35.25±0.41      35.06±0.08
                        Lipid           7.76±0.01  5.97±0.08       6.97±0.20       6.69±0.15
                        Crude fibre     3.13±0.15    5.61±0.56     5.96±0.93       5.90±0.13
                        Carbohydrate  46.86±1.42  46.50±2.24       43.10±1.26      44.51±1.52
   13   14   15   16   17   18   19   20   21   22   23