Page 21 - Aquauclature Research and Studies (01)
P. 21

AQUAUCLATURE
                        Research and Studies 1 (1): 15-01, 2026                                                   page   of 193
                                                                                      11

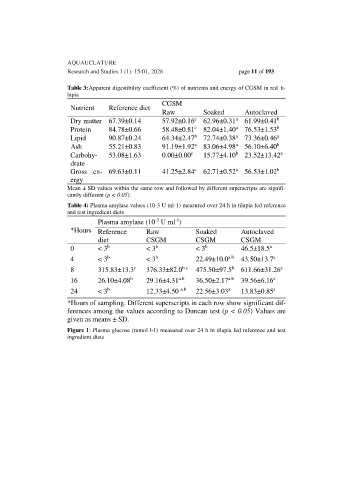
                        Table 3: Apparent digestibility coefficient (%) of nutrients and energy of CGSM in red  ti-
                        lapia
                                                        CGSM
                         Nutrient     Reference diet
                                                        Raw           Soaked       Autoclaved
                                                                                a
                                                                   c
                                                                                              b
                         Dry matter  67.39±0.14         57.92±0.16   62.96±0.31   61.99±0.41
                                                                   c
                                                                                              b
                                                                                a
                         Protein      84.78±0.66        58.48±0.81   82.04±1.40   76.53±1.53
                                                                   b
                                                                                              a
                                                                                a
                         Lipid        90.87±0.24        64.34±2.47   72.74±0.38   73.36±0.46
                                                                                              b
                                                                                a
                                                                   a
                         Ash          55.21±0.83        91.19±1.92   83.06±4.98   56.10±6.40
                                                                                b
                                                                                                a
                                                                 c
                         Carbohy-     53.08±1.63        0.00±0.00     15.77±4.10   23.52±13.42
                         drate
                                                                                a
                                                                                              b
                                                                   c
                         Gross  en- 69.63±0.11          41.25±2.84   62.71±0.52   56.53±1.02
                         ergy
                        Mean ± SD values within the same row and followed by different superscripts are signifi-
                        cantly different (p < 0.05).
                        Table 4: Plasma amylase values (10-3 U ml-1) measured over 24 h in tilapia fed reference
                        and test ingredient diets
                                                            -1
                                                     -3
                                  Plasma amylase (10  U ml )
                         *Hours   Reference       Raw              Soaked         Autoclaved
                                  diet            CSGM             CSGM           CSGM
                                                                      b
                                                                                            a
                                                     b
                                     b
                         0        < 3             < 3              < 3            46.5±18.5
                                     b
                                                                              a.b
                                                     b
                                                                                             a
                         4        < 3             < 3              22.49±10.0   43.50±13.7
                                                              b.c
                                              c
                                                                                                a
                                                                               b
                         8        315.83±13.3     376.33±82.0   475.50±97.5   611.66±31.26
                                                             a.b
                                                                              a.b
                                                                                             a
                                             b
                         16       26.10±4.08      29.16±4.31       36.50±2.17   39.56±6.16
                                                                                             a
                                                              a.b
                                                                              a
                                     b
                         24       < 3             12.33±4.50       22.56±3.03     13.83±0.85
                        *Hours of sampling. Different superscripts in each row show significant dif-
                        ferences among the values according to Duncan test (p < 0.05) Values are
                        given as means ± SD.
                        Figure 1: Plasma glucose (mmol l-1) measured over 24 h in tilapia fed reference and test
                        ingredient diets
   16   17   18   19   20   21   22   23   24   25   26