
Page 50 - Aquauclature Research and Studies (01)
P. 50
AQUAUCLATURE
40
Research and Studies 1 (1): 15-01, 2026 page of 193
Statistical analysis
Descriptive statistics of the studied trails were calculated using Summary
procedure of SAS (2004). The effect five factors of chemical composition of
microalgae, two factors add microalgae of diets on larvae Red tilapia.
RESULTS
The algal growth
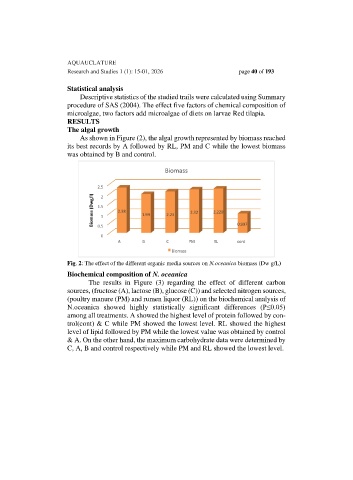
As shown in Figure (2), the algal growth represented by biomass reached
its best records by A followed by RL, PM and C while the lowest biomass
was obtained by B and control.
Fig. 2: The effect of the different organic media sources on N.oceanica biomass (Dw g/L)
Biochemical composition of N. oceanica
The results in Figure (3) regarding the effect of different carbon
sources, (fructose (A), lactose (B), glucose (C)) and selected nitrogen sources,
(poultry manure (PM) and rumen liquor (RL)) on the biochemical analysis of
N.oceanica showed highly statistically significant differences (P≤0.05)
among all treatments. A showed the highest level of protein followed by con-
trol(cont) & C while PM showed the lowest level. RL showed the highest
level of lipid followed by PM while the lowest value was obtained by control
& A. On the other hand, the maximum carbohydrate data were determined by
C, A, B and control respectively while PM and RL showed the lowest level.