
Page 54 - Aquauclature Research and Studies (01)
P. 54
AQUAUCLATURE
Research and Studies 1 (1): 15-01, 2026 page of 193
44
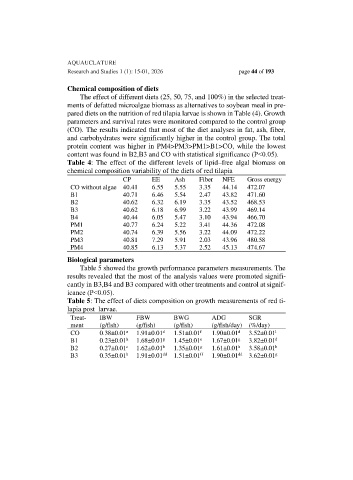
Chemical composition of diets
The effect of different diets (25, 50, 75, and 100%) in the selected treat-
ments of defatted microalgae biomass as alternatives to soybean meal in pre-
pared diets on the nutrition of red tilapia larvae is shown in Table (4). Growth
parameters and survival rates were monitored compared to the control group
(CO). The results indicated that most of the diet analyses in fat, ash, fiber,
and carbohydrates were significantly higher in the control group. The total
protein content was higher in PM4>PM3>PM1>B1>CO, while the lowest
content was found in B2,B3 and CO with statistical significance (P˂0.05).
Table 4: The effect of the different levels of lipid–free algal biomass on
chemical composition variability of the diets of red tilapia
CP EE Ash Fiber NFE Gross energy
CO without algae 40.41 6.55 5.55 3.35 44.14 472.07
B1 40.71 6.46 5.54 2.47 43.82 471.60
B2 40.62 6.32 6.19 3.35 43.52 468.53
B3 40.62 6.18 6.99 3.22 43.99 469.14
B4 40.44 6.05 5.47 3.10 43.94 466.70
PM1 40.77 6.24 5.22 3.41 44.36 472.08
PM2 40.74 6.39 5.56 3.22 44.09 472.22
PM3 40.81 7.29 5.91 2.03 43.96 480.58
PM4 40.85 6.13 5.37 2.52 45.13 474.67
Biological parameters
Table 5 showed the growth performance parameters measurements. The
results revealed that the most of the analysis values were promoted signifi-
cantly in B3,B4 and B3 compared with other treatments and control at signif-
icance (P˂0.05).
Table 5: The effect of diets composition on growth measurements of red ti-
lapia post larvae.
Treat- IBW FBW BWG ADG SGR
ment (g/fish) (g/fish) (g/fish) (g/fish/day) (%/day)
CO 0.38±0.01 a 1.91±0.01 d 1.51±0.01 f 1.90±0.01 d 3.52±0.01 l
B1 0.23±0.01 h 1.68±0.01 g 1.45±0.01 e 1.67±0.01 g 3.82±0.01 d
B2 0.27±0.01 c 1.62±0.01 h 1.35±0.01 g 1.61±0.01 h 3.58±0.01 h
B3 0.35±0.01 b 1.91±0.01 dd 1.51±0.01 ff 1.90±0.01 dd 3.62±0.01 g