
Page 55 - Aquauclature Research and Studies (01)
P. 55
AQUAUCLATURE
Research and Studies 1 (1): 15-01, 2026 page of 193
45
B4 0.25±0.01 e 1.71±0.01 e 1.46±0.01 ee 1.70±0.01 f 3.64±0.01 f
PM1 0.21±0.01 g 1.82±0.01 f 1.61±0.01 d 1.81±0.01 e 4.06±0.01 c
PM2 0.23±0.01 f 1.94±0.01 c 1.71±0.01 c 1.93±0.01 c 4.09±0.01 b
PM3 0.26±0.01 d 2.06±0.01 b 1.80±0.01 b 2.05±0.01 b 4.09±0.0 bb
PM4 0.25±0.01 ee 2.19±0.01 a 1.94±0.01 a 2.18±0.01 a 4.25±0.01 a
(IBW) Initial body weight – (FBW) Final body weight- (BWG) Body weight gain- (ADG)
Average daily gain- (SGR) Specific growth rate
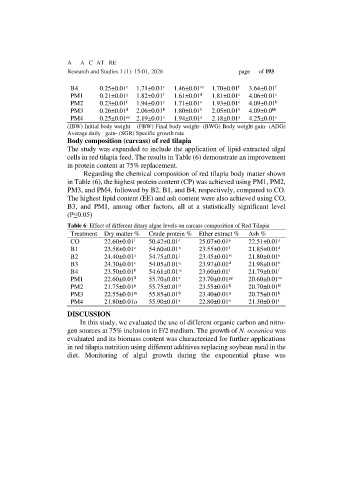
Body composition (carcass) of red tilapia
The study was expanded to include the application of lipid-extracted algal
cells in red tilapia feed. The results in Table (6) demonstrate an improvement
in protein content at 75% replacement.
Regarding the chemical composition of red tilapia body matter shown
in Table (6), the highest protein content (CP) was achieved using PM1, PM2,
PM3, and PM4, followed by B2, B1, and B4, respectively, compared to CO.
The highest lipid content (EE) and ash content were also achieved using CO,
B3, and PM1, among other factors, all at a statistically significant level
(P≤0.05)
Table 6: Effect of different ditary algae levels on carcass composition of Red Tilapia
Treatment Dry matter % Crude protein % Ether extract % Ash %
CO 22.60±0.01 l 50.42±0.01 r 25.07±0.01 a 22.51±0.01 a
B1 23.58±0.01 e 54.60±0.01 n 23.55±0.01 l 21.85±0.01 d
B2 24.40±0.01 a 54.75±0.01 j 23.45±0.01 m 21.80±0.01 e
B3 24.30±0.01 c 54.05±0.01 q 23.97±0.01 d 21.98±0.01 b
B4 23.50±0.01 h 54.61±0.01 m 23.60±0.01 i 21.79±0.01 f
PM1 22.60±0.01 ll 55.70±0.01 e 23.70±0.01 gg 20.60±0.01 oo
PM2 21.75±0.01 p 55.75±0.01 d 23.55±0.01 ll 20.70±0.01 ll
PM3 22.55±0.01 m 55.85±0.01 b 23.40±0.01 n 20.75±0.01 k
PM4 21.80±0.01o 55.90±0.01 a 22.80±0.01 o 21.30±0.01 i
DISCUSSION
In this study, we evaluated the use of different organic carbon and nitro-
gen sources at 75% inclusion in F/2 medium. The growth of N. oceanica was
evaluated and its biomass content was characterized for further applications
in red tilapia nutrition using different additives replacing soybean meal in the
diet. Monitoring of algal growth during the exponential phase was