
Page 49 - Aquauclature Research and Studies (01)
P. 49
AQUAUCLATURE
39
Research and Studies 1 (1): 15-01, 2026 page of 193
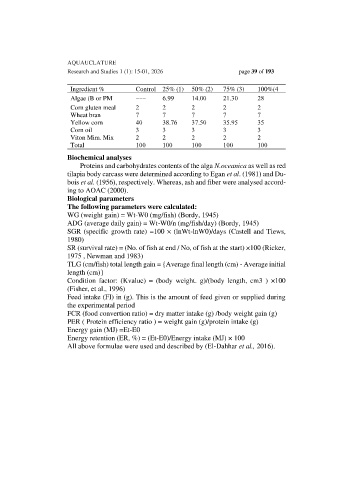
Ingredient % Control 25% (1) 50% (2) 75% (3) 100%(4
Algae (B or PM --- 6.99 14.00 21.30 28
Corn gluten meal 2 2 2 2 2
Wheat bran 7 7 7 7 7
Yellow corn 40 38.76 37.50 35.95 35
Corn oil 3 3 3 3 3
Viton Mim. Mix 2 2 2 2 2
Total 100 100 100 100 100
Biochemical analyses
Proteins and carbohydrates contents of the alga N.oceanica as well as red
tilapia body carcass were determined according to Egan et al. (1981) and Du-
bois et al. (1956), respectively. Whereas, ash and fiber were analysed accord-
ing to AOAC (2000).
Biological parameters
The following parameters were calculated:
WG (weight gain) = Wt-W0 (mg/fish) (Bordy, 1945)
ADG (average daily gain) = Wt-W0/n (mg/fish/day) (Bordy, 1945)
SGR (specific growth rate) =100 × (lnWt-lnW0)/days (Castell and Tiews,
1980)
SR (survival rate) = (No. of fish at end / No, of fish at the start) ×100 (Ricker,
1975 , Newman and 1983)
TLG (cm/fish) total length gain = {Average final length (cm) - Average initial
length (cm)}
Condition factor: (Kvalue) = (body weight. g)/(body length, cm3 ) ×100
(Fisher, et al., 1996)
Feed intake (FI) in (g). This is the amount of feed given or supplied during
the experimental period
FCR (food convertion ratio) = dry matter intake (g) /body weight gain (g)
PER ( Protein efficiency ratio ) = weight gain (g)/protein intake (g)
Energy gain (MJ) =Et-E0
Energy retention (ER, %) = (Et-E0)/Energy intake (MJ) × 100
All above formulae were used and described by (El-Dahhar et al., 2016).